Create Data Discovery Dashboards
This applies to: Visual Data Discovery
Dashboards allow you to collect, display, and share data and information with your users to analyze in a variety of ways. Responsive dashboard layouts make your data accessible to your users flexibly, accommodating different screen sizes and embedded presentation layouts.
- A dashboard is a collection of one or more visuals, filter snippets, and rich text snippets in individual widgets.
- Visuals in a dashboard can include data form one or more data sources. For example, add visuals that use Solr, Impala, Elasticsearch, and a fused data source to provide a comprehensive view of information from these varied sources.
- Dashboard filters allow your users to search on and highlight specific data temporarily.
- Use rich text snippets to provide context to your visual data using formatted text, links, and images.
- Symphony's responsive layout for dashboards makes it easy for you and users arrange and layout these widgets as needed, flexible and optimized for multiple screen sizes, from large display boards to handy mobile devices.
- A visual is a single view of data source data.
- Local visuals are unique to a dashboard; edit and adjust to test data and analysis difference approaches. Changes to local visuals do not affect other dashboards. Convert to a Visual Gallery visual at any time.
- Visual Gallery visuals are stored in the visual gallery. Any changes saved for these visuals are reflected in all dashboards that contain these visuals. Convert to a local visual at any time.
- Rich text snippets round out your user's data experience by describing your data in context, linking external resources, and including images.
- A filter snippet is a series of links you build between visuals based on custom values and fields. Your users can use the filter to view connected data in multiple visuals quickly and easily.
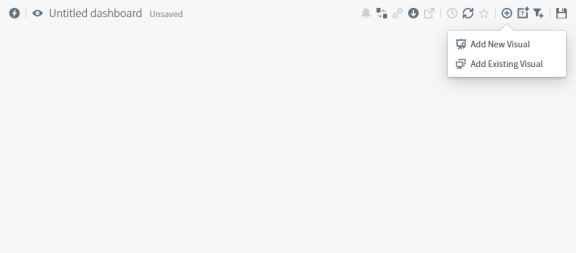
When you create a new dashboard, you are prompted to add a new visual or an existing visual, but you can add a rich text snippet or simply save the dashboard and return to edit it later. The dashboard is saved in the dashboard library.
Create a dashboard with a visual or rich text snippet:
-
Log in as an administrator or a user who has been assigned to a group with the Administer Dashboards privilege or Create Dashboards privilege.
-
Select Library from the main menu in the Data Discovery work area. The data discovery dashboard library opens.
-
Select Add Dashboard. A blank dashboard appears showing options to add a new visual, place an existing visual, or add a rich text snippet.

-
Select Add New Visual to add a new local visual to the dashboard. Select Add Existing Visual to add an existing visual from the visual gallery to the dashboard.
- If you select Add New Visual, follow the procedure described in Add Visuals to a Dashboard
- If you select Add Existing Visual, follow the procedure described in Add Existing Visuals to a Dashboard.
-
Select
 to add a rich text snippet to the dashboard. See Add Rich Text Snippets to a Dashboard.
 -
Select
 to add a filter snippet to the dashboard. See Add Filter Snippets to a Dashboard.
 -
Save your dashboard. Accept the default name, or supply a name for the dashboard.
You can continue to add visuals and snippets. See Add Visuals to a Dashboard and Add Existing Visuals to a Dashboard, Add Rich Text Snippets to a Dashboard, and Add Filter Snippets to a Dashboard.
After a dashboard is created, you can explore its data and work directly with its various visuals. You can modify, copy, export or delete its visuals. In addition, the data on the visual can be filtered (see Filter Data). Finally, you can share, export, or delete the dashboard (see Manage Data Discovery Dashboards).