Use the Symphony Data Discovery Dashboard Library
This applies to: Visual Data Discovery
The work area of the dashboard library contains all dashboards in your environment to which you have access. You can make a dashboard a favorite, delete it (if your privileges allow), and open the dashboard.
If your user definition has not been given access to dashboards, you will see no dashboards in the dashboard library and you will not be able to import any dashboards. You will be able to create dashboards, but you will not be able to save them. Contact your system administrator to increase your privileges.
Access the Dashboard Library
To access the dashboard library, select Library on the UI menu. The dashboard library opens, and dashboards display in a table (list) format.

Search Box
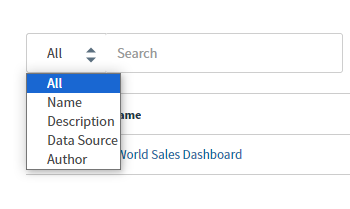
You can use the search box to filter the dashboards in this work area by dashboard Name, Description (if provided) Data Source, or Author. For example, if you type a C in the search box, only dashboards that include the letter C in the selected field searched are shown in the working area.

Buttons
The buttons on the page allow easy access to saved dashboards, as well as other dashboards created by other users in your Symphony environment. They also allow you to create a new dashboard, filter the dashboards that are shown, or import a dashboard.
| Button | Description |
|---|---|
| All | Removes any filters for the dashboard library and displays all dashboards available to you within your environment. |

|
Displays only the dashboards that you have marked as favorites. |

|
Displays only dashboards that you created and saved. Dashboards created and saved by other users are hidden. |

|
Displays only the dashboards that other users shared with you. See Share a Data Discovery Dashboard with Users Inside Your Account. |
|
|
Select to generate an embeddable dashboard link. |
| Import Dashboard | Allows you to import a dashboard. See Import a Data Discovery Dashboard. |
|
Create Dashboard |
Allows you to create a new dashboard. See Create Data Discovery Dashboards. |
The Dashboard List
The dashboard list columns are described below.
| Column | Description |
|---|---|
| Fav | Identifies favorite dashboards using a star icon. If the star is colored ( |
| Name | The name of the dashboard. |
| Description (not labeled) | The description, if provided, for the dashboard. |
| Data Source | The name of the data sources used by the dashboard. |
| Author | The user who created the dashboard. |
| Date Modified | The date the dashboard was last modified. |
| Permissions | Select the |
| Schedule | Select the clock ( |
| Actions |
Shows icons you can select to perform actions for the dashboard.
|
Sort the Dashboard List
You can sort the dashboard list by dashboard name, the date the dashboard was last modified, the data source for the dashboard, or the dashboard owner name. By default, dashboards are sorted alphabetically by dashboard name. Select a column title in the list to sort the dashboards by the data in the column. By default the list is sorted in alphabetical order by the data in the column. To sort the list in reverse alphabetical order, select the column title a second time.