Enable the Time Bar for a Visual
This applies to: Visual Data Discovery
To enable the time bar for a visual:
-
Select the visual in the dashboard or in the Visual Gallery.
-
If you selected the visual on a dashboard, select Settings on the visual drop-down menu to access the sidebar menu for the visual.
-
Select the visual time bar icon (
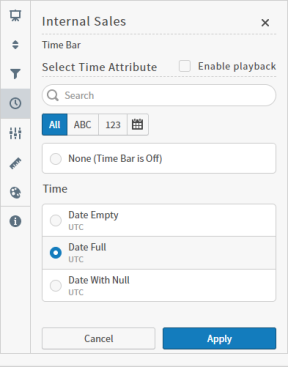
 ) on the sidebar menu for the visual. The Time Bar sidebar opens.
-
Select a time attribute on the Time Bar sidebar. The None (Time Bar is Off) option is not available for the Line charts.
-
Optionally, select the Enable playback checkbox to enable the Play/Pausebutton (the Data DVR functionality) on the Time Bar. You can enable or disable this option in the Global Default Settings section for your data source. For more information about the requirements for playback, see Live Mode and Historical Playback.
-
Select Apply.
-
Save the visual or dashboard.
After the time bar is enabled, you can use it for the visual. If additional visuals on the dashboard are create from the same data source, you can use a unified time bar. See Work with Unified Time Bars.