Viewing the Applied Filters for a Visual
This applies to: Visual Data Discovery
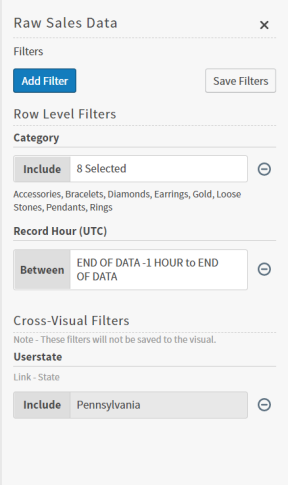
You can view the filters that have been applied to a visual using the Filters sidebar or directly on the visual. Note that the filters are categorized into row-level filters and cross-visual filters. Row-level filters are saved with the visual; cross-visual filters are not.
To view filters on the Filters sidebar:
-
Select the filter icon (
 ) on the visual or select
  on the sidebar menu. If the visual is in a dashboard, select Settings from the visual menu (
 ), then select on the sidebar menu.
 The Filters sidebar appears showing any filters that have been applied.
To view filters directly on the visual:
-
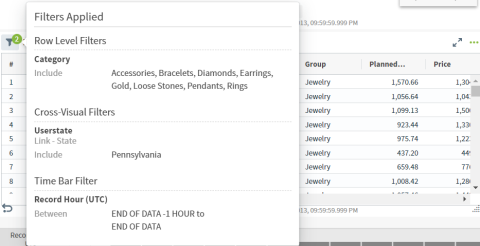
Hover over the filter icon (
) on the visual.The Filters sidebar appears showing any filters that have been applied. The following example shows a visual with three filters applied: a row level filter by sales category, a cross-visual filter for the state of Pennsylvania, and a time bar filter.
 Time bar filters are not included in the total filter count shown in the green circle.